CEA vs TDK vs RPA
There are three major computer programs, of which I’m aware, that calculate one dimensional equilibrium (ODE) performance of rocket engines, CEA, TDK and RPA. Back in 2006 I was interested in comparing the results of these three codes for common propellant combinations, just to see if they all gave similar results. I created charts of the difference in ODE Isp performance for CEA vs TDK and for RPA vs TDK.
Currently these codes are available at:
The TDK code is the accepted standard for the JANNAF performance calculation method. As far as I know, JANNAF only controls a version of TDK from 1993 and the only modern versions are the two commercial versions above.
One very important reason that TDK is the JANNAF standard is that, unlike CEA and RPA, the TDK code can calculate the kinetics loss in the nozzle. (i.e. ODE assumes infinite time for combustion product chemistry to come to equilibrium everywhere in the nozzle, whereas the kinetics calculation accounts for the actual time available for the chemistry to approach equilibrium in the nozzle.)
This kinetics loss can be a very important consideration for rocket performance, especially in small thrust, low pressure, high area ratio engines.
It is my understanding that the developers of TDK started with a version of CEA developed by Bonnie J. McBride and Sanford Gordon and added more capabilities to it, so there is some expectation that those two codes should agree reasonably well on ODE Isp.
The developers of TDK (Software & Engineering Associates) also created the SPP (Solid Performance Program) code that calculates performance of solid propulsion Isp. Because of this, it’s probably true that TDK handles condensibles and particulates better than CEA or RPA. (This likely also explains why RPA crashes and CEA gets divergent answers at very high area ratio, where condensibles are likely to occur.) Note that SPP is also available from Sierra Engineering & Software, Inc..
Although I do not know which code creates the most accurate values, I used TDK as the basis because it is the JANNAF standard. Each chart displays a very large spectrum of runs over a range of area ratios(2 to 512), chamber pressures(50 to 3200 psia) and mixture ratios that cover the maximum expected range of operation as well as extending to extremely ox rich and fuel rich.
The main observations are:
For common propellants, all of the codes agree very well in expected MR range of operation.
For some storable propellants, RPA predicts higher Isp ODE than both CEA and TDK
When extremely ox or fuel rich, CEA diverges and RPA crashes.
Large differences (and RPA crashes) tend to happen at extremely large area ratios.
Bear in mind that these numbers were run in 2006. I don’t think much has changed in any of the codes that would affect these results, however, that is strictly a GUESS on my part.
Chart Description
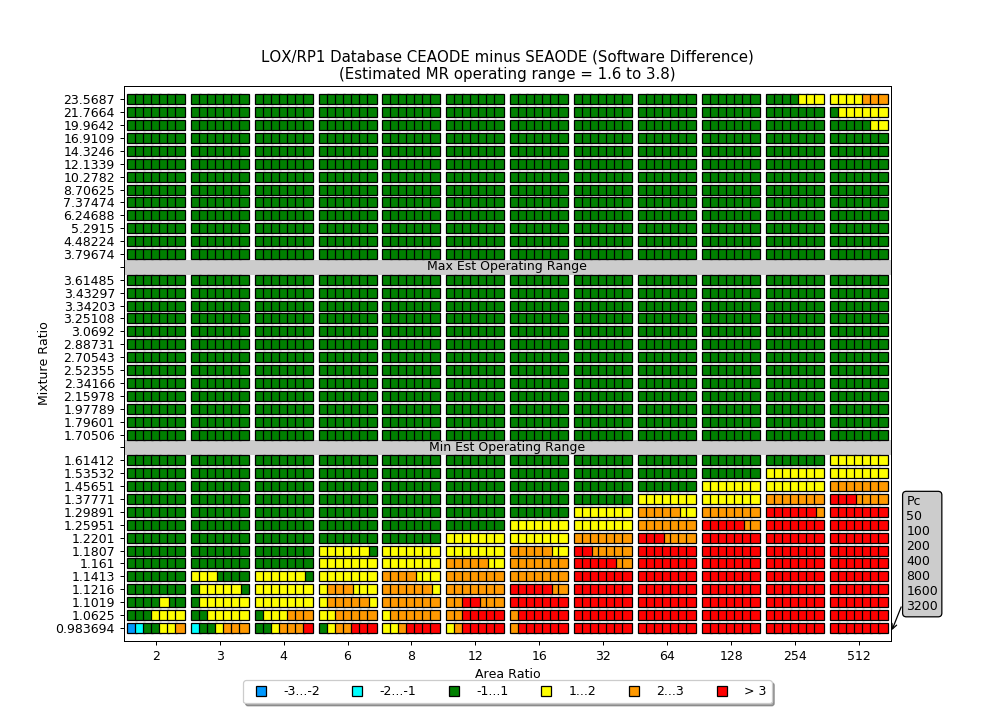
Each chart color-codes the difference in Isp ODE between two software packages (CEA vs TDK) and (RPA vs TDK) with the following scale.

Cyan, Light Blue, Dark Blue indicate lower than TDK by -1 to -2, -2 to -3 or <-3 seconds of Isp respectively.
Green indicates agreement within 1 second of Isp.
Yellow, Orange, Red indicate higher than TDK by 1 to 2, 2 to 3 or >3 seconds of Isp respectively.
The X and Y axes are obvious and labeled as Area Ratio and Mixture Ratio.
Notice, however, that there are horizontal bars on the mixture ratio axis indicating the minimum and maximum expected MR operating range.
| Chamber pressure on the charts is somewhat less obvious. For each Mixture Ratio and Area Ratio, the range of Chamber Pressure results (50 to 3200 psia) are shown as a bar of colors, one for each Pc. | 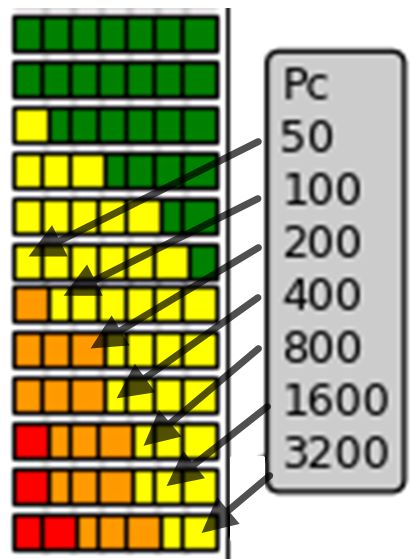 |
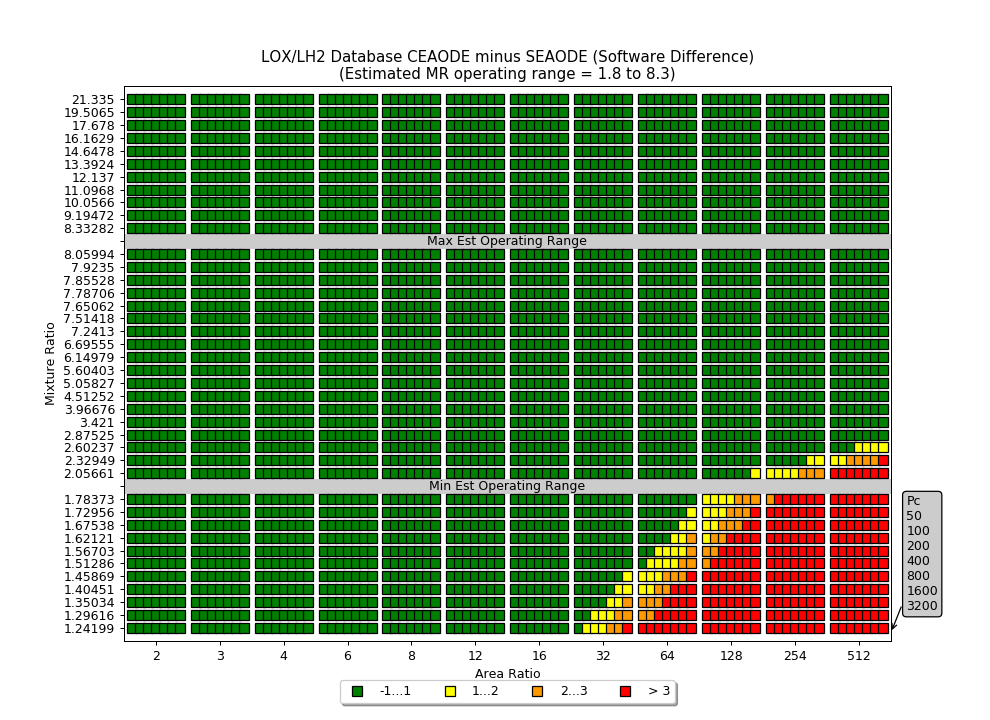
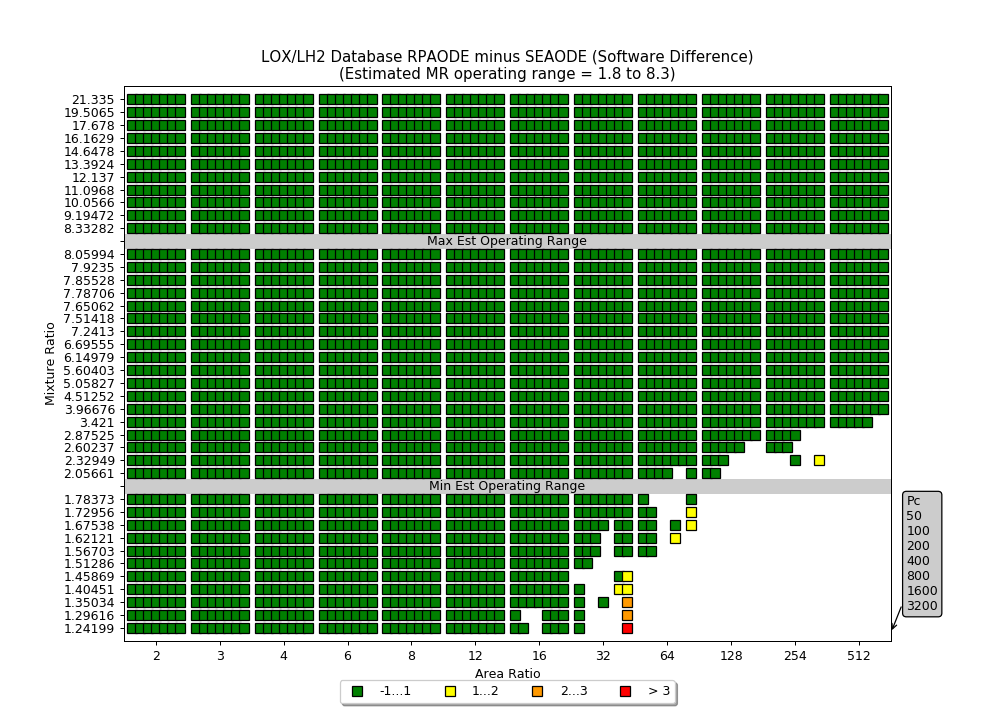
LOX/LH2
LOX/LH2 has very good agreement between all three codes.
High area ratio, low MR is where differences occur.
In those areas, CEA gets more than 3 seconds higher than TDK and RPA crashes.
Note
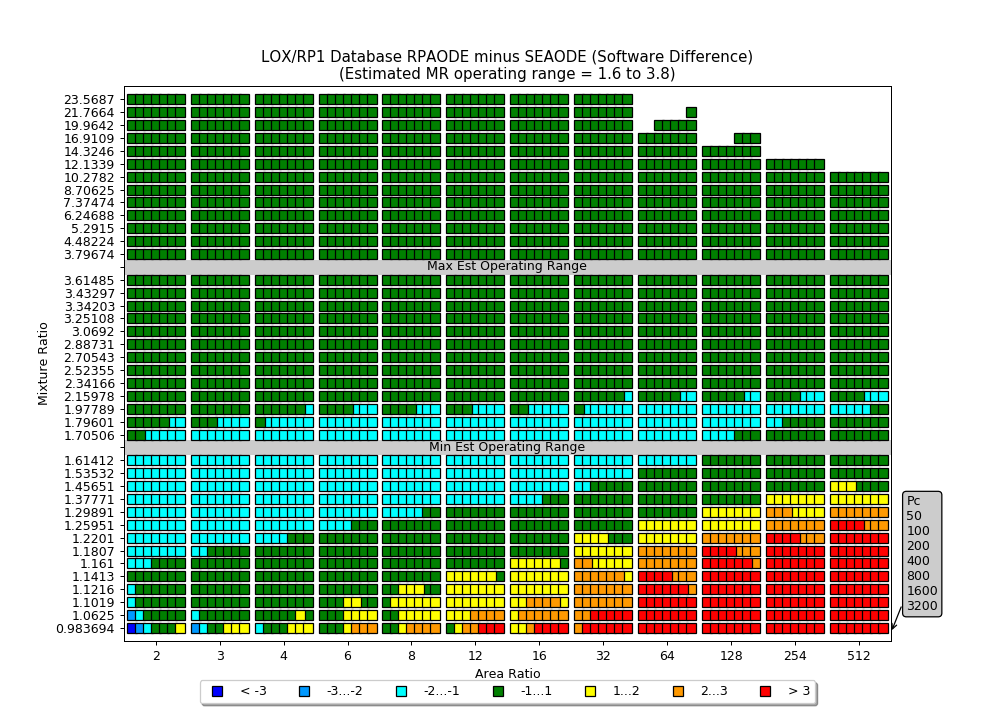
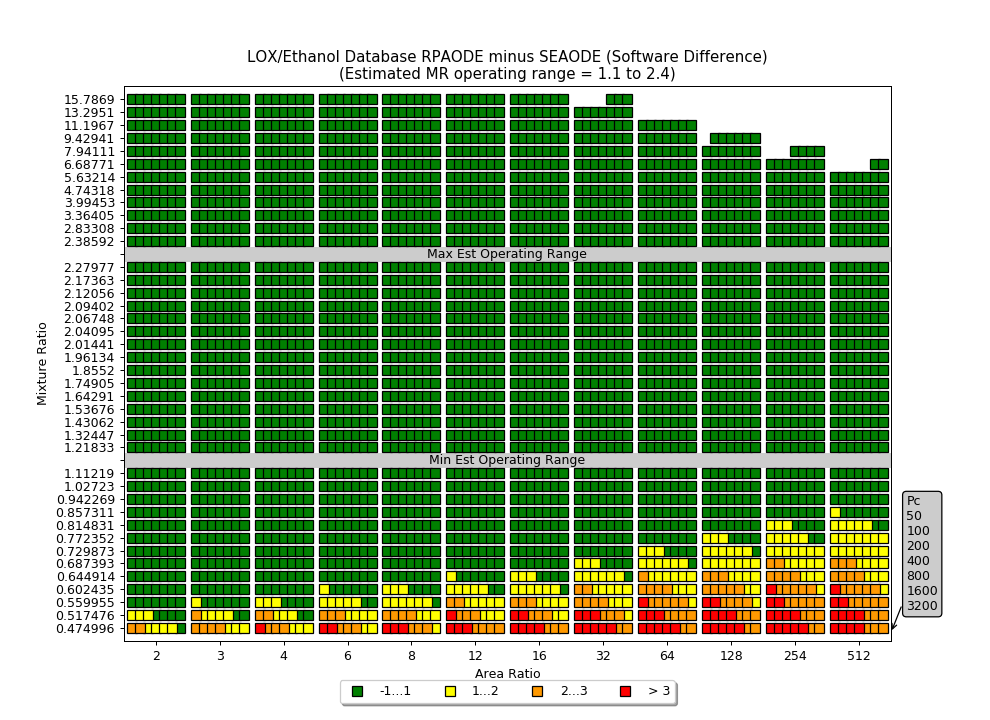
Blank areas in the RPA chart is where that code crashes.
| CEA | RPA |
|---|---|
|
|

|
|
|
Click images to see full size |
|
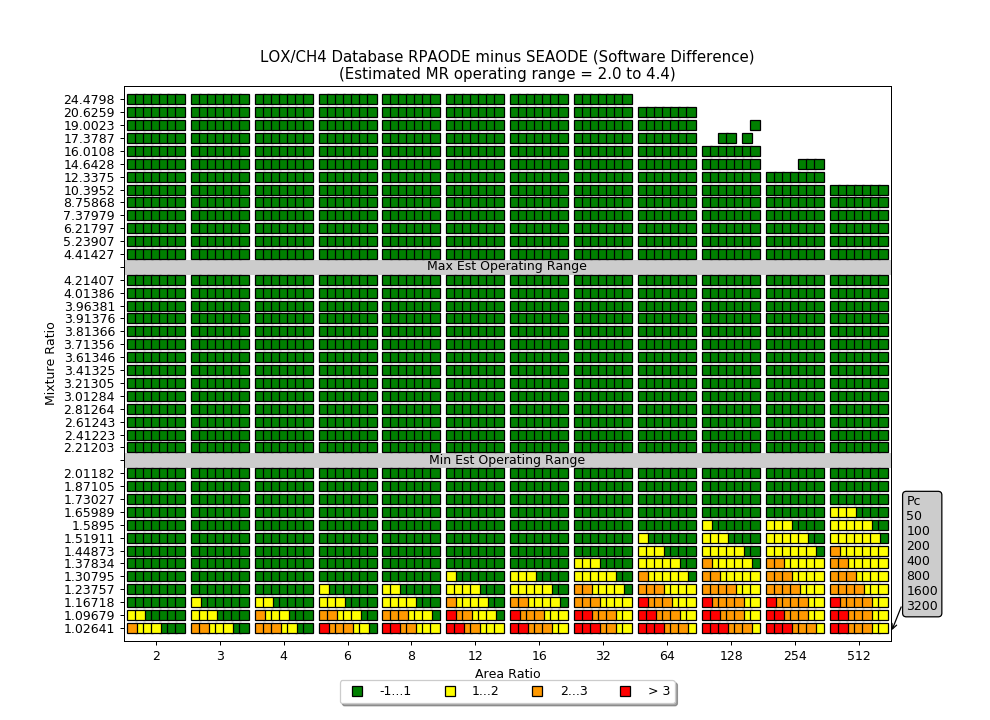
LOX/CH4
LOX/LCH4 has very good agreement between all three codes.
Both CEA and RPA diverge at low MR.
RPA crashes at very high MR for very high area ratios.
| CEA | RPA |
|---|---|

|
|
|
|
|
|
Click images to see full size |
|
LOX/RP1
For LOX/RP1 CEA has good agreement with TDK, however, RPA calculates as much as 2 seconds lower than TDK in the low portion of the expected MR range.
Both CEA and RPA diverge at low MR.
RPA crashes at very high MR for very high area ratios.
| CEA | RPA |
|---|---|
|
|
|
|
|
|
Click images to see full size |
|
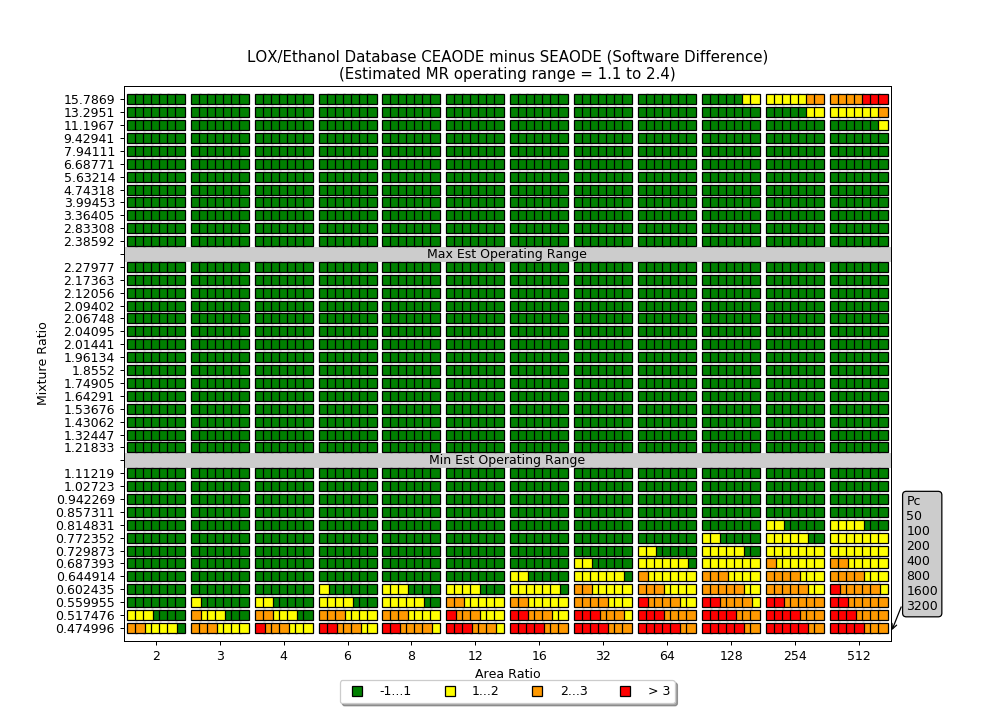
LOX/Ethanol
LOX/Ethanol results are virtually identical to LOX/CH4 results.
Good agreement between all three codes.
Both CEA and RPA diverge at low MR.
RPA crashes at very high MR for very high area ratios.
| CEA | RPA |
|---|---|
|
|
|
|
|
|
Click images to see full size |
|
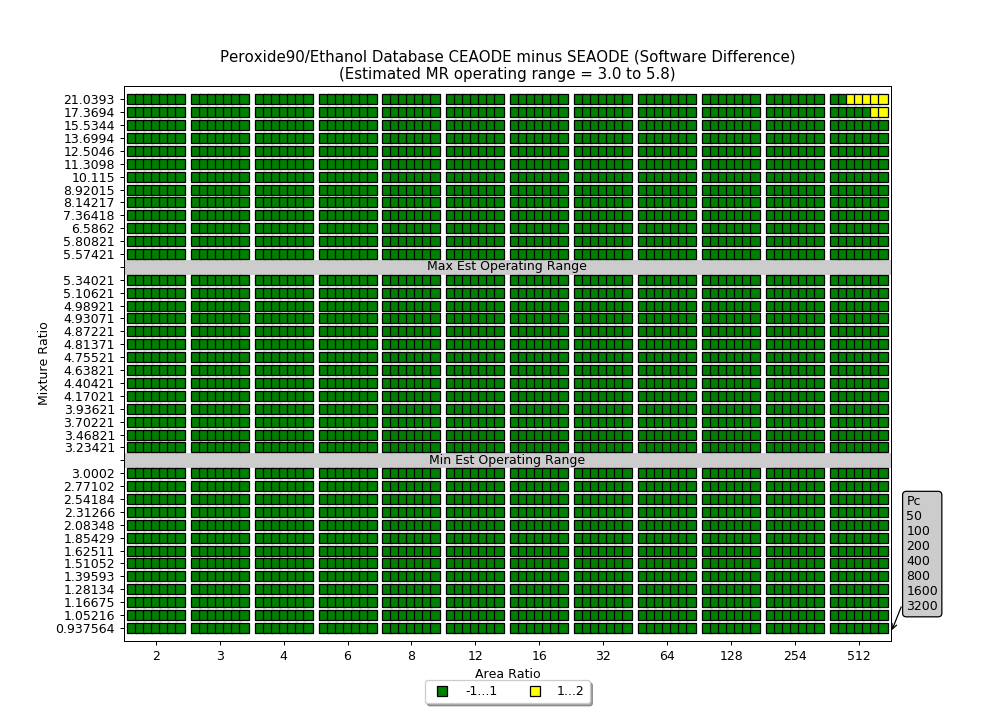
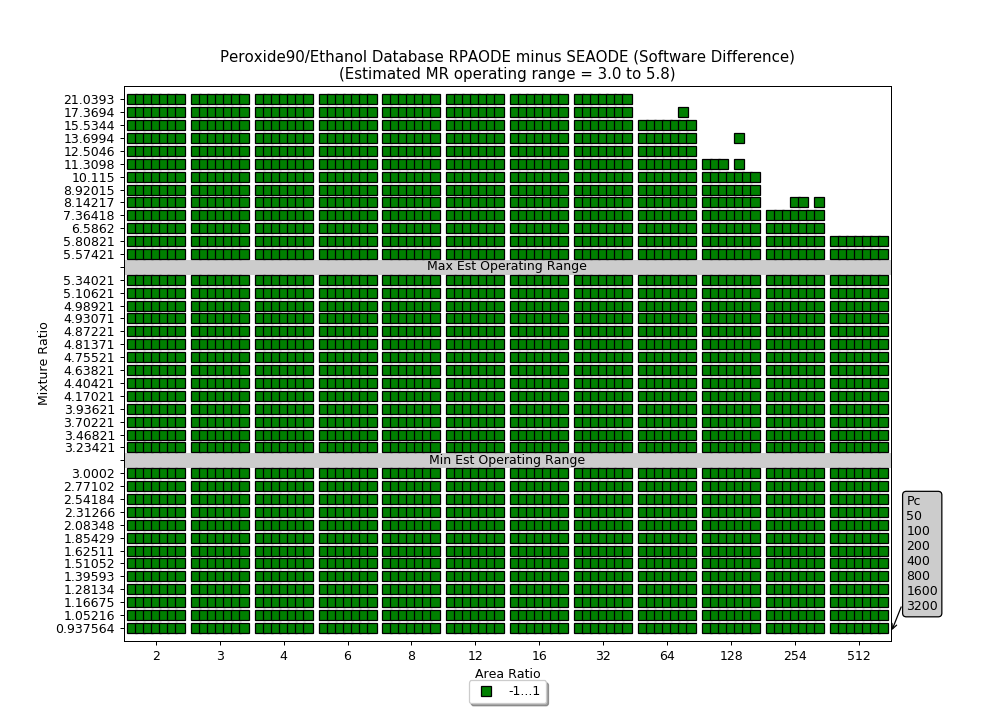
Peroxide90/Ethanol
Peroxide90/Ethanol has excellent agreement between all three codes.
RPA crashes at very high MR for very high area ratios.
| CEA | RPA |
|---|---|
|
|
|
|
|
|
Click images to see full size |
|
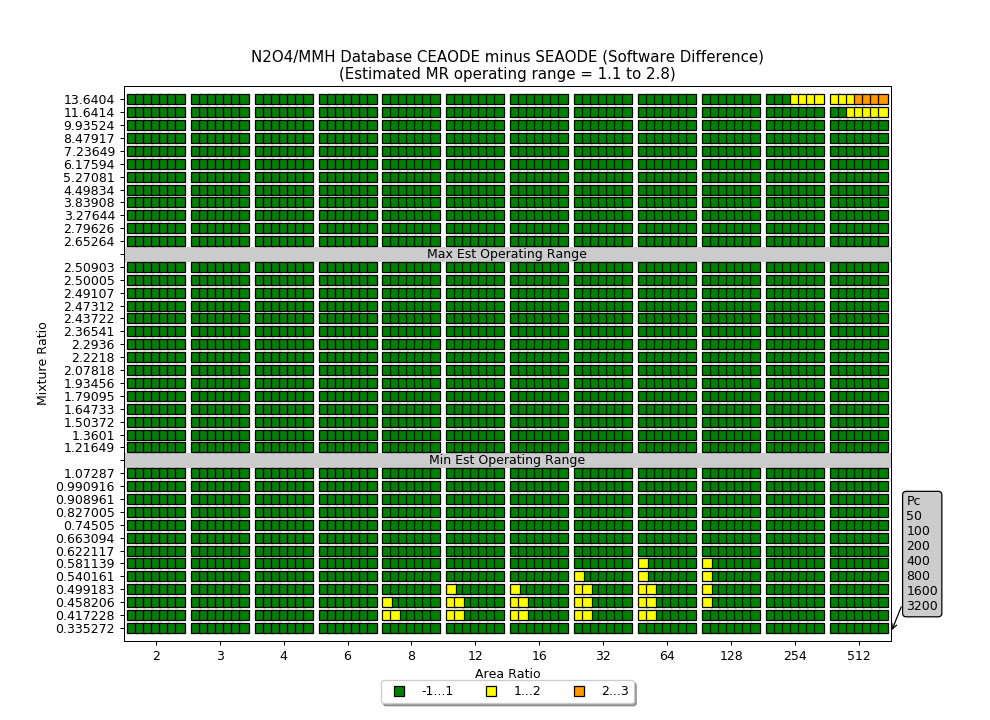
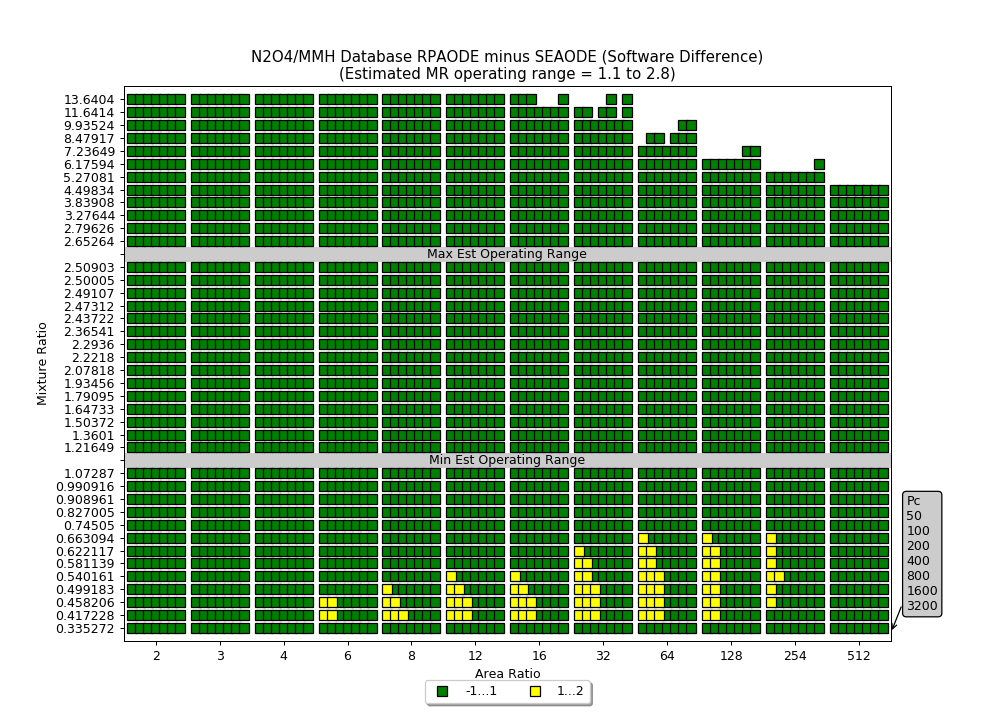
N2O4/MMH
N2O4/MMH has excellent agreement between all three codes.
RPA crashes at very high MR for very high area ratios.
| CEA | RPA |
|---|---|
|
|
|
|
|
|
Click images to see full size |
|
N2O4/N2H4
N2O4/N2H4 has excellent agreement between all three codes.
RPA crashes at both very high and very low MR with high area ratio.
| CEA | RPA |
|---|---|
|

|
|
|
|
|
Click images to see full size |
|
MON25/MHF3
for MON25/MHF3, CEA has good agreement
RPA predicts high everywhere, and has some crashes at very high MR for high area ratio.
| CEA | RPA |
|---|---|

|

|
|
|
|
|
Click images to see full size |
|
CLF5/N2H4
for CLF5/N2H4, CEA has good agreement in the expected MR range, but predicts higher Isp at the MR extremes.
RPA predicts high everywhere, and has some crashes at very high area ratio.
| CEA | RPA |
|---|---|
|
|
|
|
|
|
Click images to see full size |
|